Your website goes down at 2 AM — do you find out from your users or from your monitoring tool? Dotcom-Monitor is a platform that watches your sites, APIs, and servers around the clock so you don’t have to.
Disclaimer: We would like to thank Dotcom-Monitor for providing us with access to their product for testing and review on our blog. All opinions expressed in this article are our own.
Today we review a monitoring and performance testing solution called Dotcom-Monitor at https://www.dotcom-monitor.com/.
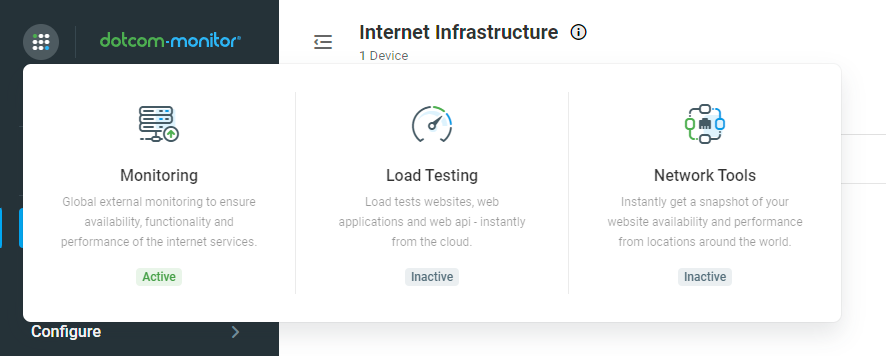
Dotcom-Monitor offers three main features:
- Monitoring
- Load Testing
- Network Tools
In this article, we are going to check what the Monitoring feature has to offer.
Monitoring
First impression — the Dotcom-Monitor website looks pretty slick. You can create what they call “Devices”, which are essentially monitors that check your website or service at repeating intervals for availability, functionality, and performance.
By clicking the top-right [+ New Device] green button, you get a huge list of options to choose from:
HTTP/S, SOAP Web API, REST Web API, FTP, FTP over SSH, Streaming Media, VoIP SIP, Email POP3 / IMAP4, Email Round Trip, Email ActiveSync, Email DNS Blacklist, DNS, Ping / ICMP, Traceroute, UDP, Telnet, Custom Script, WebSocket, and more.
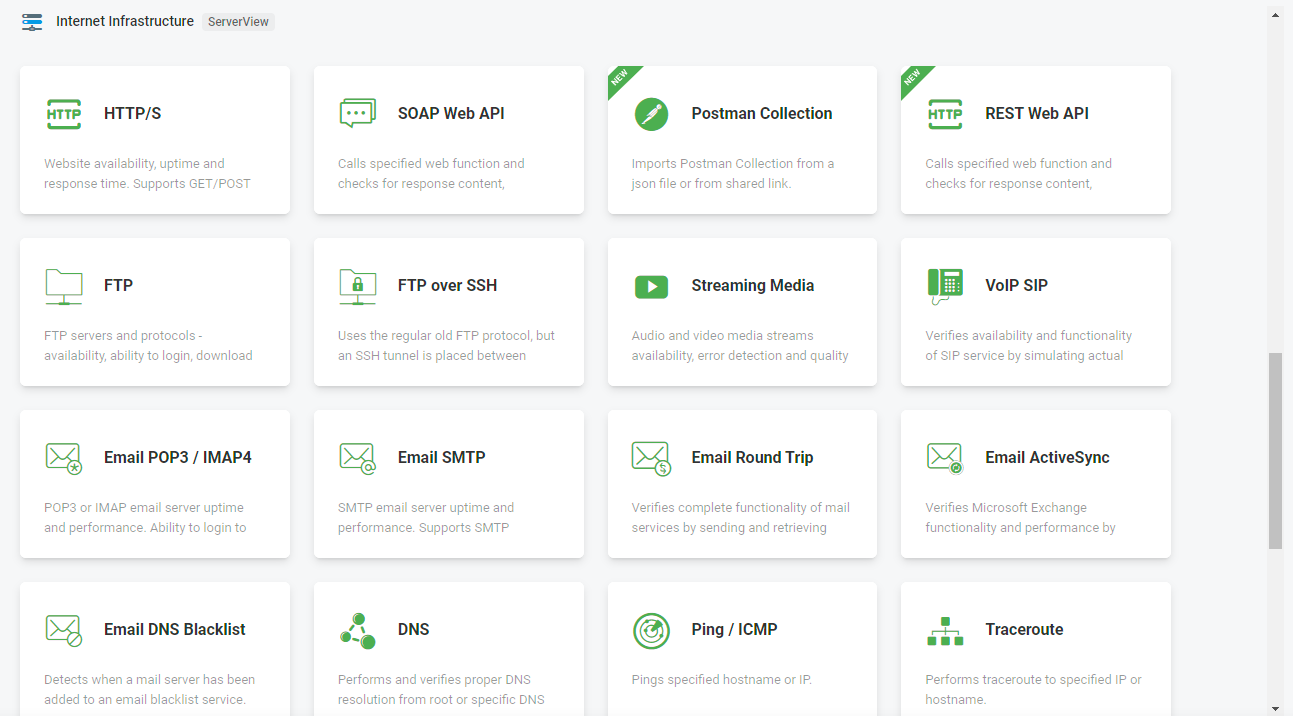
You can monitor almost every type of service you run. Check that your website is responsive every 5 minutes and track its loading time. Do the same for your FTP server, ping or telnet your infrastructure, test your SOAP/REST/WebSocket services — nearly anything you can imagine.
You can also import your Postman collection, create a custom script, or record steps navigating through your web pages to mimic a real user’s behavior. Import scripts from other devices, upload scripts, and much more.
On top of that, you can collect data from Windows servers, Linux servers (using collect), SNMP, or create any custom metric you like.
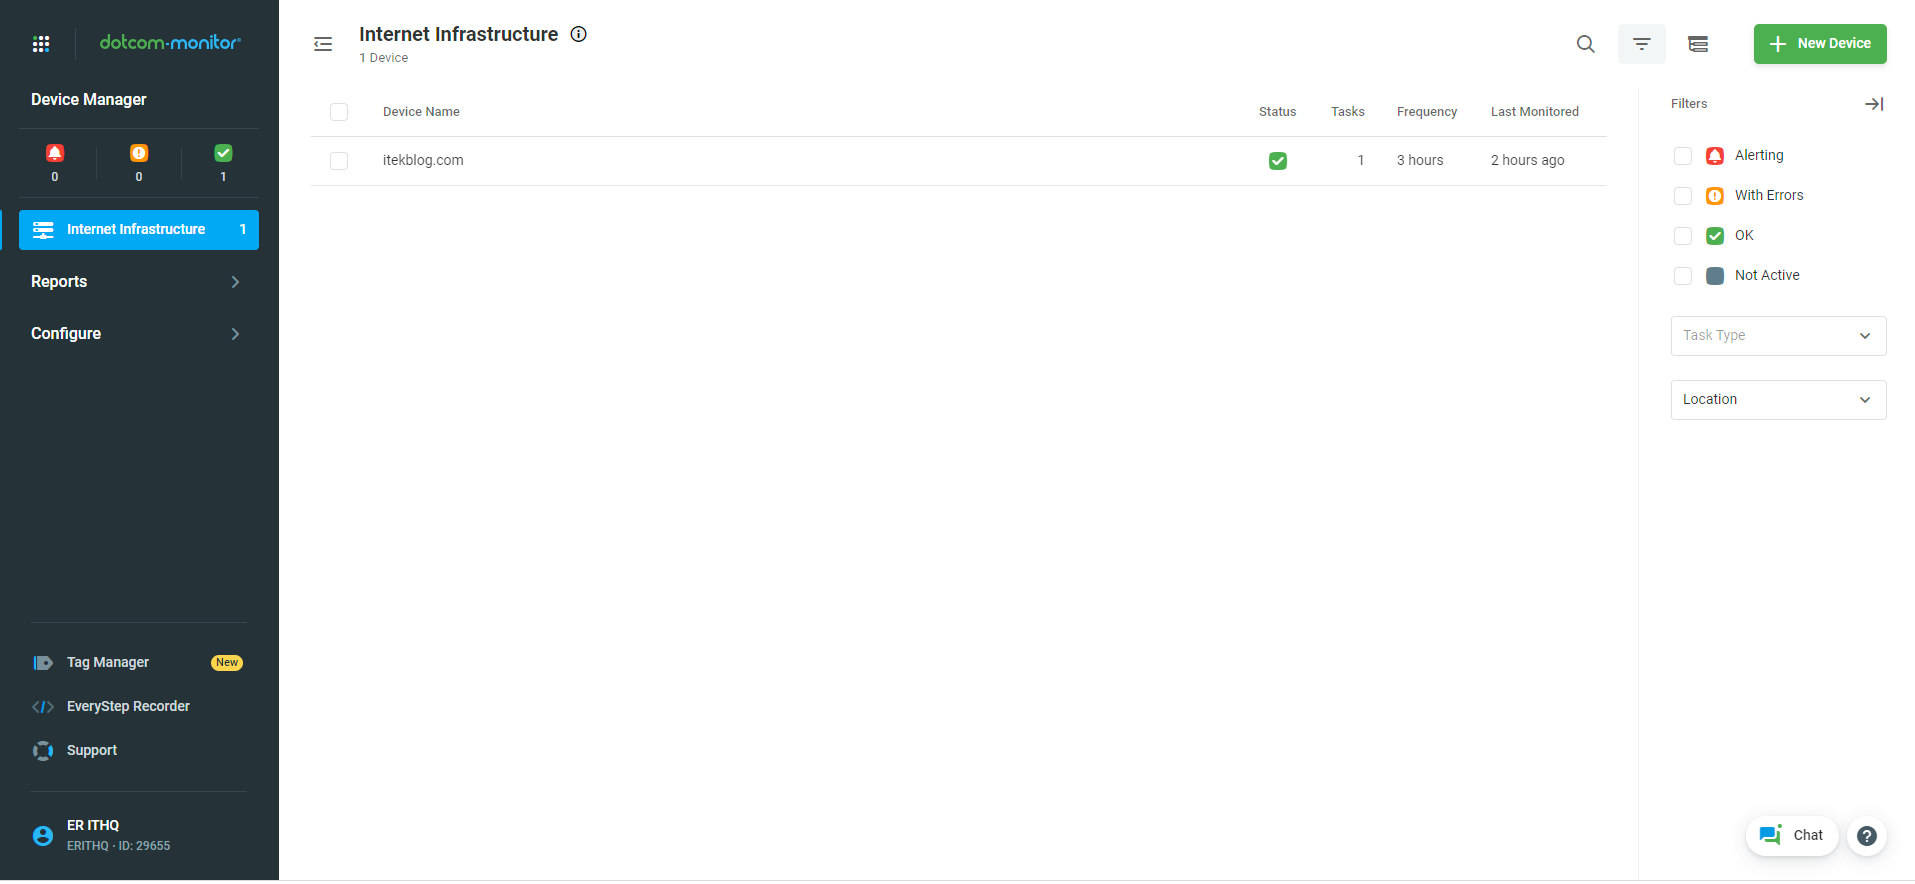
Let’s try it out by monitoring this very website: https://itekblog.com/
We created an HTTP/S monitoring device for our site. Here you can see the device configuration — the URL to monitor, expected response, and timeout settings:

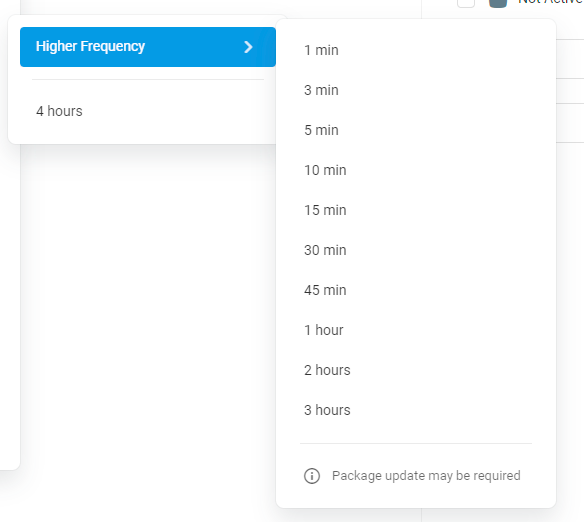
It now runs every 3 hours, checking if everything is in shape — whether our site is online and returning the correct response.
You can configure the frequency to whatever suits your needs. Options range from every minute up to every 24 hours:
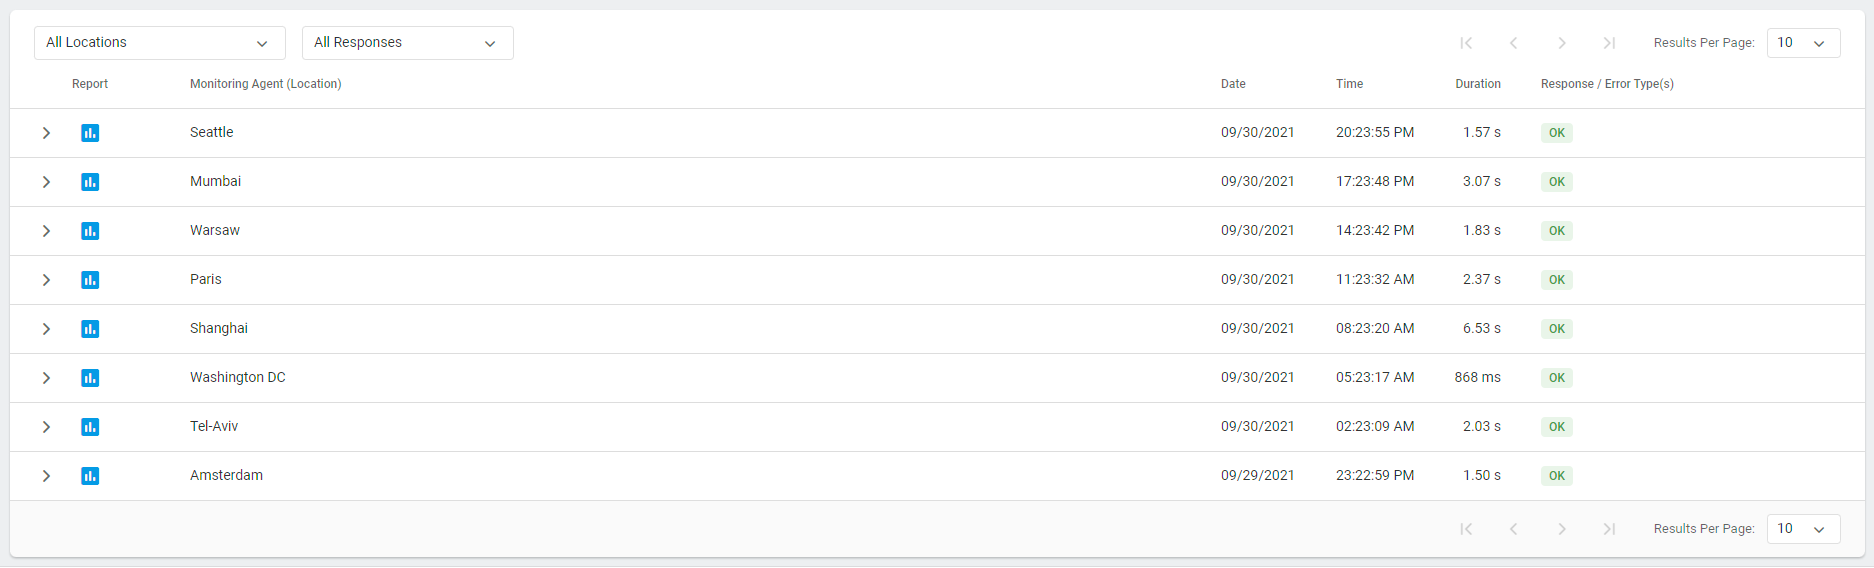
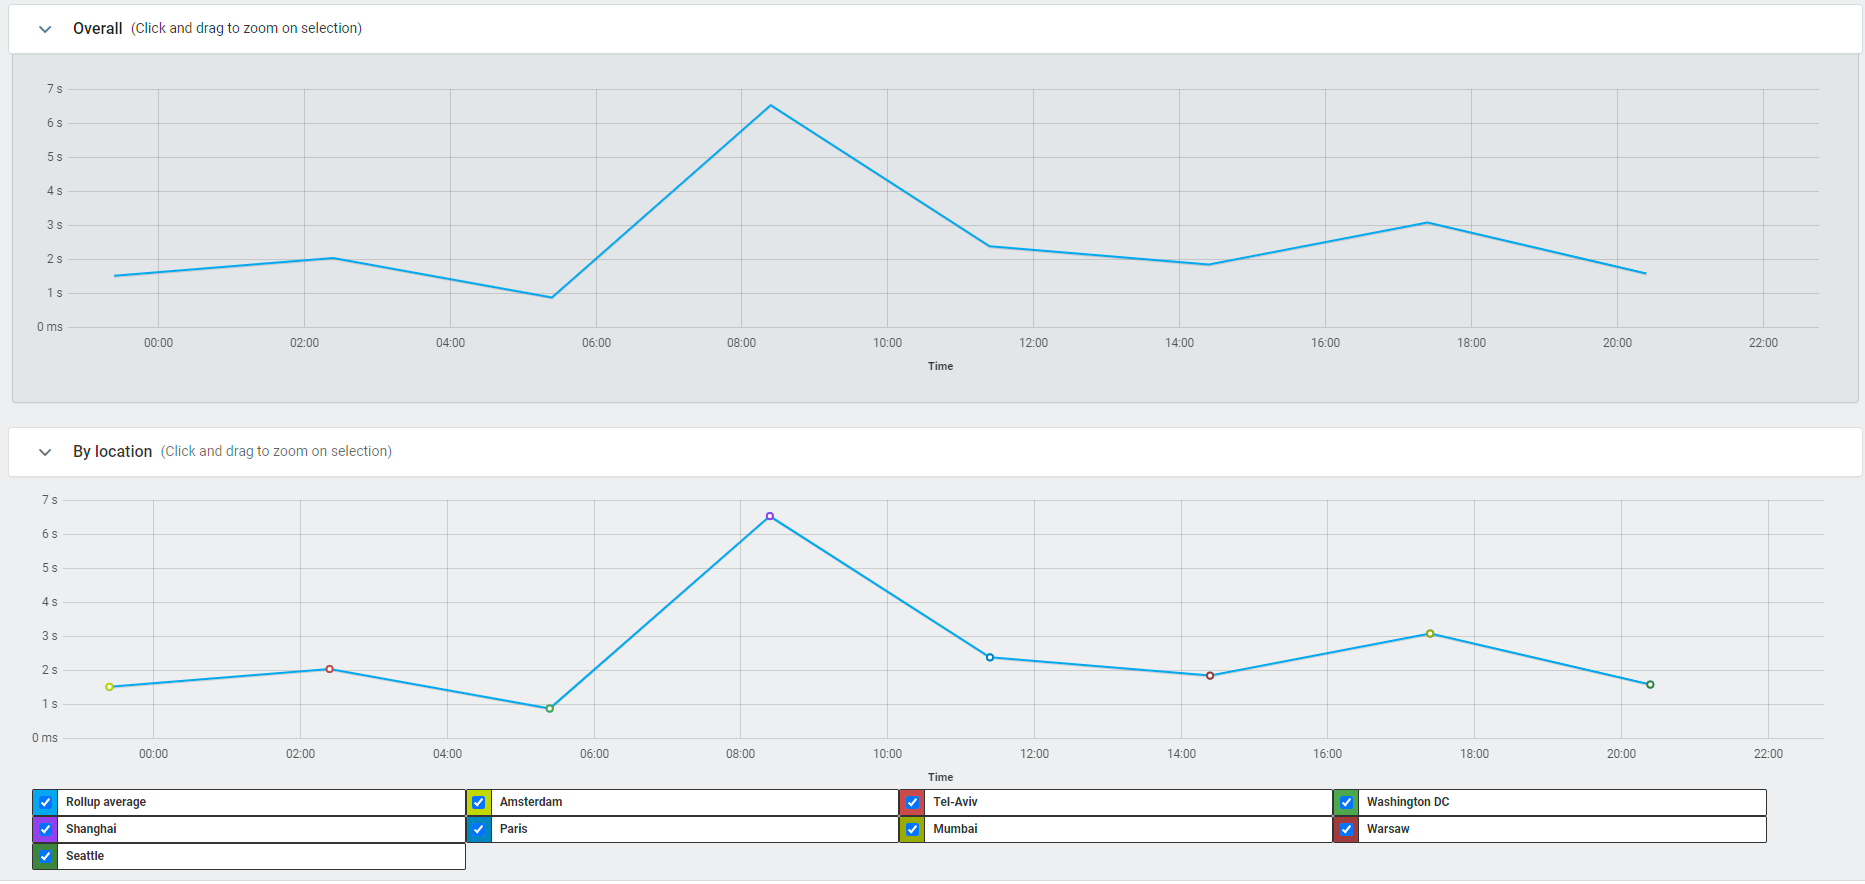
It works by calling the website from locations all over the world. We configured 8 of them: Seattle, Mumbai, Warsaw, Paris, Shanghai, Washington DC, Tel Aviv, and Amsterdam. Below you can see the log — each row is a check from a different location, with the status code and response time:
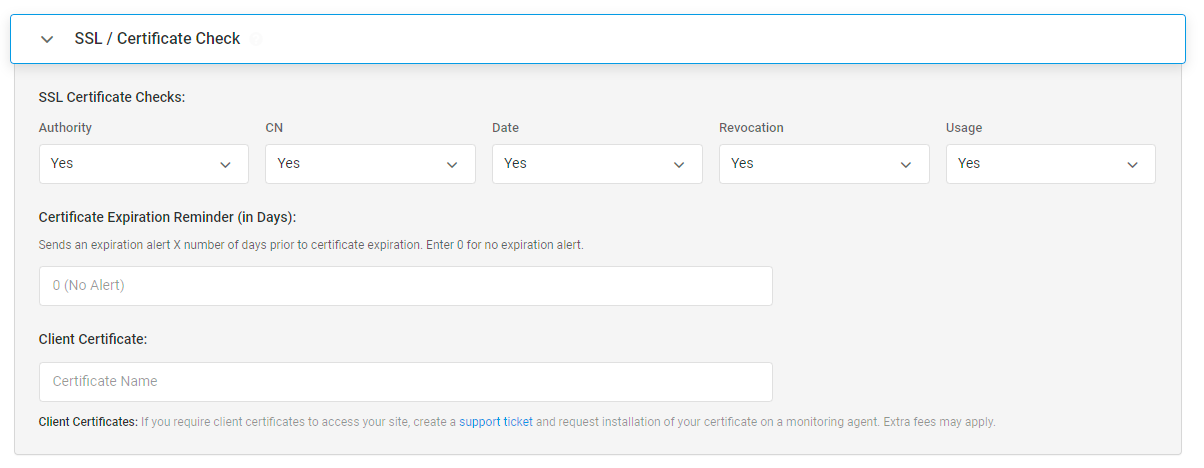
Not only that — it also notifies us if our SSL certificate is invalid or about to expire. You can set the threshold for how many days before expiration you want to be alerted:
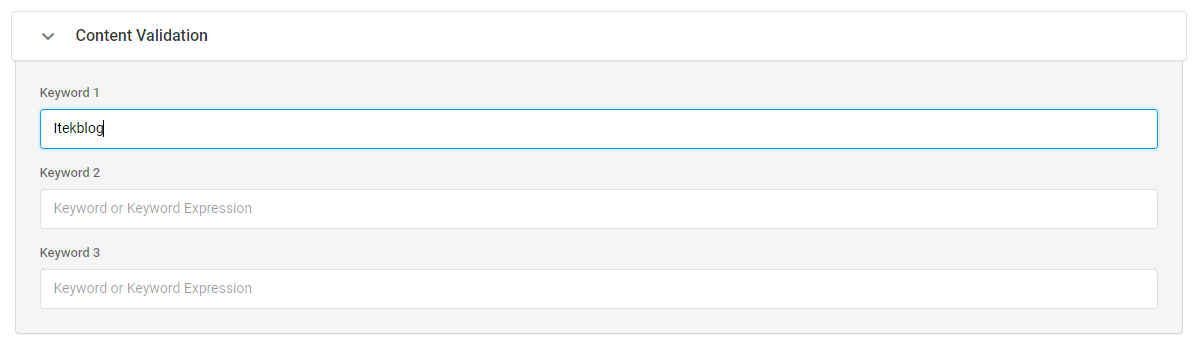
And it verifies that expected content is present on the page. For example, you can require that a specific string appears in the response body — if it’s missing, something is wrong:
It also supports Basic Authentication, header verification, prepare scripts, and post scripts. Everything you need is there.
Reporting
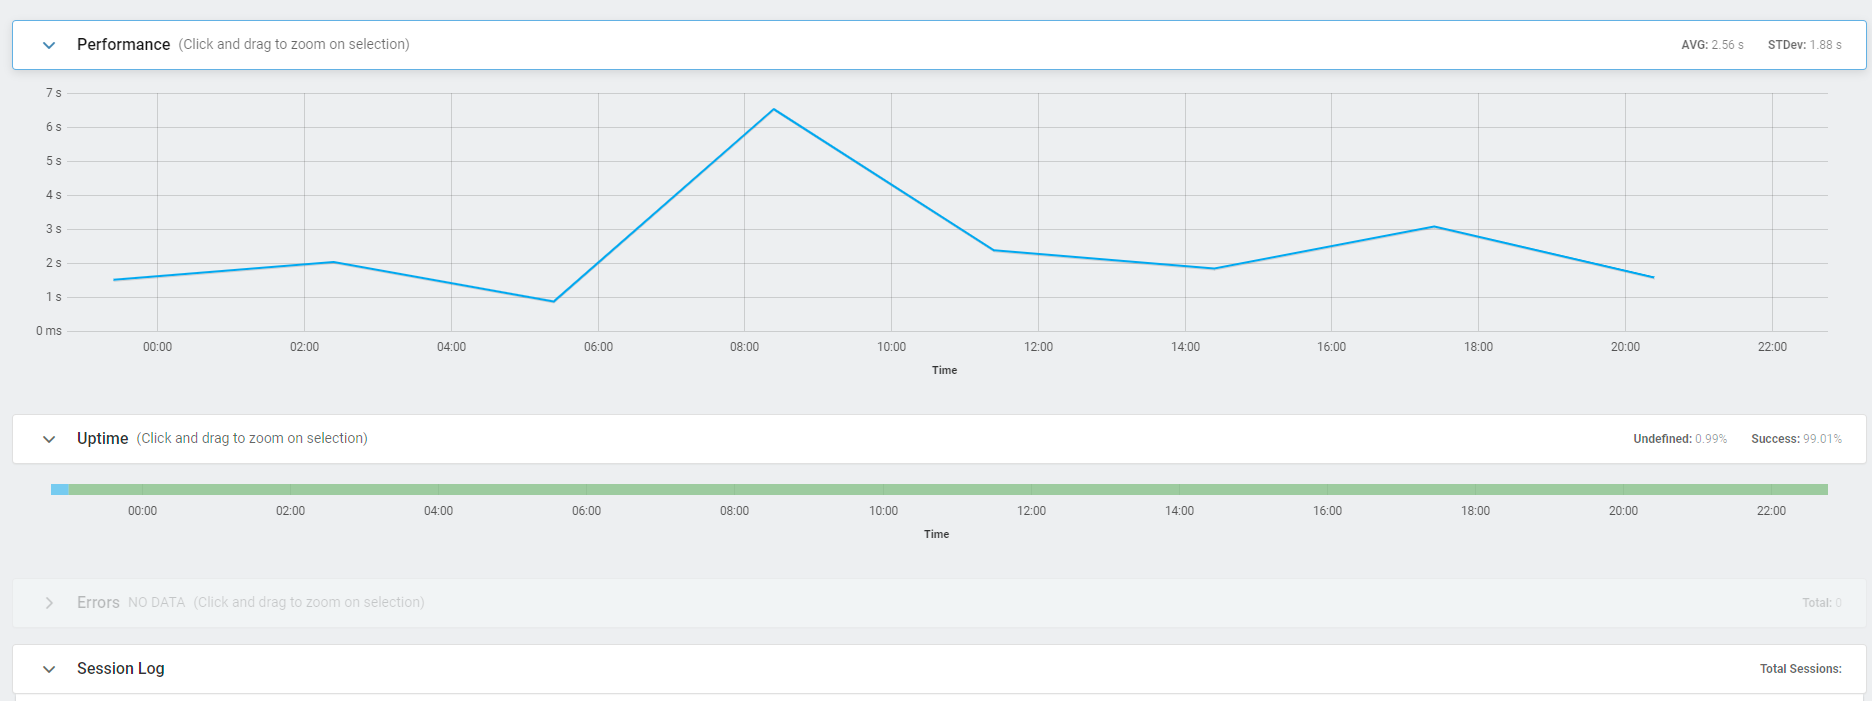
Looking at the logs, the website responds correctly with a 200 status for all locations, with response times ranging from 1.50s to 6.53s. The big gap between locations tells us we definitely need a CDN!
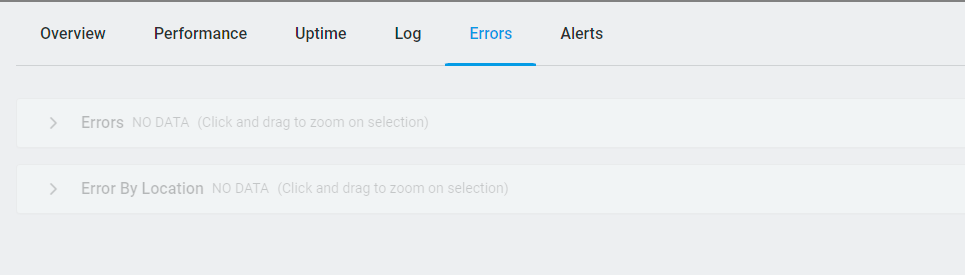
You can also view the error log — which fortunately is empty for us:
There are plenty of graphs to help you analyze your website’s performance and availability. The first chart below shows response times per location over time, and the second breaks down availability percentages:
Alerts
You can receive email alerts that update you on the status of your website. Send them to one address or multiple — and you can even customize the email template.
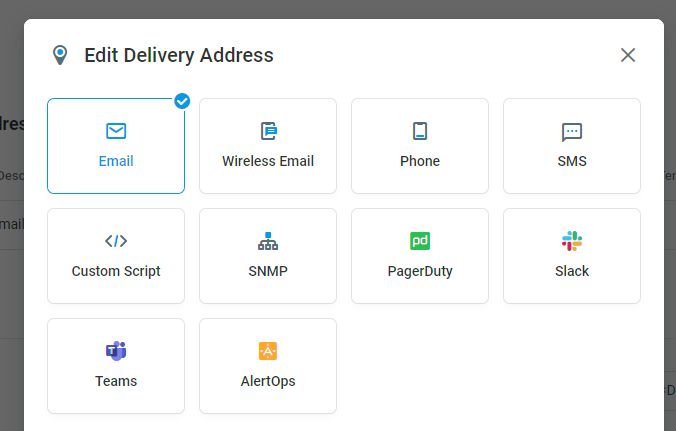
But it’s not limited to email. You can get alerts however you prefer: email, phone, SMS, Slack, and more. The screenshot below shows the alert group configuration where you set up your notification channels:
Beyond Monitoring
There is so much more to explore: performance dashboards, shareable panels, report cards, SLA reporting, real-time XML feeds, and more.
And remember, we only covered the monitoring section of this tool. There is also load testing and network tools that round out the full platform.
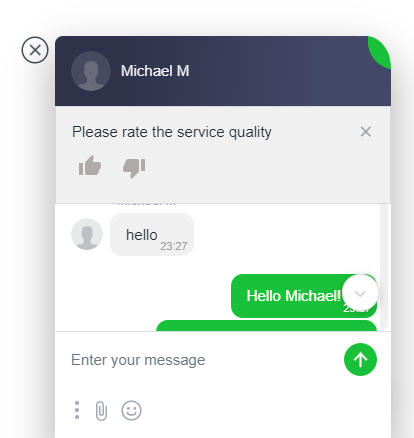
If you ever need help, their live chat is excellent — we got a response within seconds.
What Could Be Better
No tool is perfect, and there are a few areas where Dotcom-Monitor could improve:
- Learning curve — The sheer number of device types and configuration options can feel overwhelming at first. A guided setup wizard for common use cases (like basic website uptime monitoring) would help new users get started faster.
- UI density — Some screens pack a lot of information, which is great for power users but can be hard to navigate when you’re just getting started.
- Pricing for small projects — Starting at $19.95/mo, it may be more than what a solo developer or small blog needs. A free tier with limited checks would lower the barrier to entry.
That said, none of these are dealbreakers — once you get past the initial setup, the platform delivers.
Final Verdict
Dotcom-Monitor is a solid, full-featured monitoring platform. If you run anything that needs to stay online — a website, an API, a mail server — it has you covered with checks from worldwide locations, flexible alerting, and detailed reporting. We’d recommend it for teams and businesses that take uptime seriously.
Pricing
Dotcom-Monitor comes in a few tiers, from $19.95/mo to $39.95/mo:
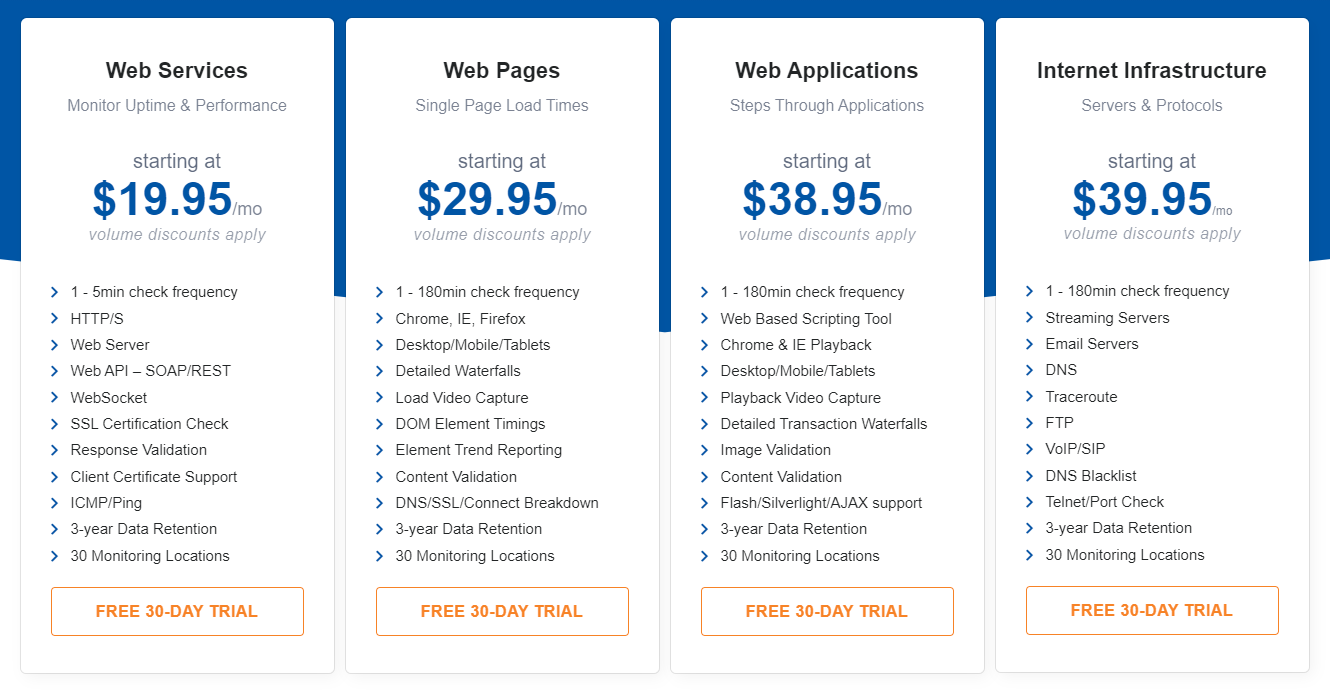
More information on their pricing page.

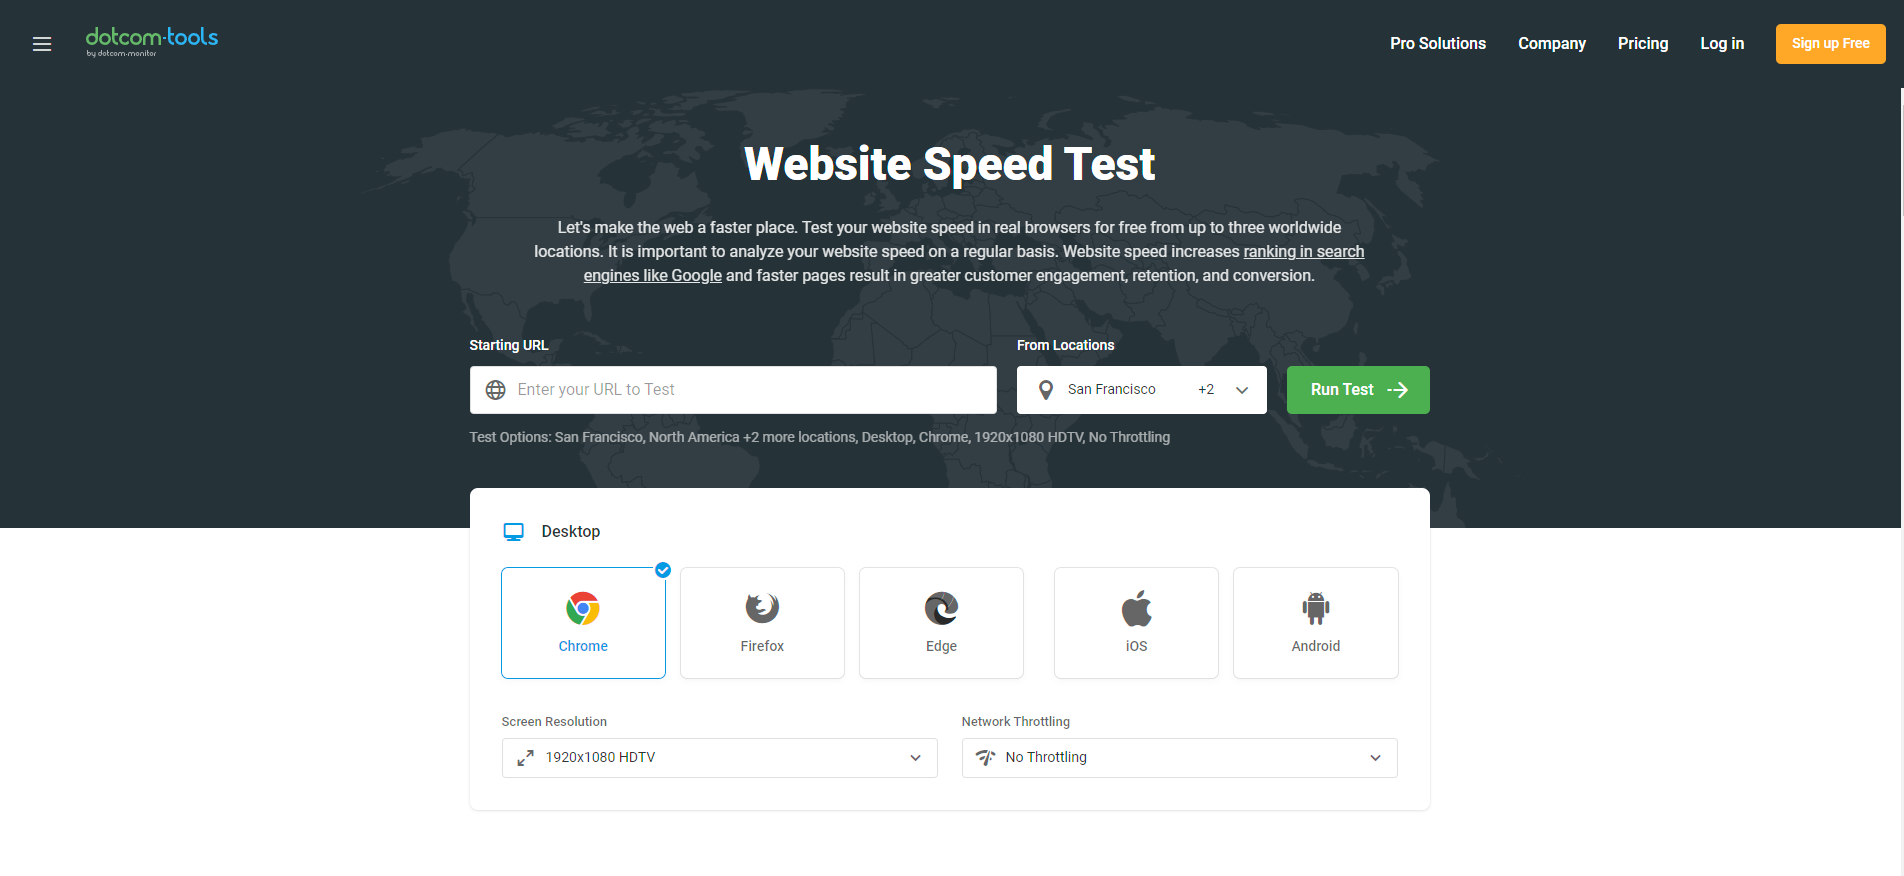
Dotcom-Monitor also offers a free Website Speed Test that lets you test your site in real browsers from multiple worldwide locations — worth a quick try even if you don’t sign up for the full platform.